

Build a room temperature monitor using Azure and Arduino Nano - Part 2
Create dashboards in Azure Data Explorer using azure IoT Hub data


In Part 1 of this tutorial, we configured an Arduino to measure the room temperature and upload the measurements to Azure IoT Hub. In this tutorial, we are going to create an Azure stream analytics job to get the raw data from IoT Hub and transform it. Then, the transformed data will be sent to Azure Data Explorer where it will be permanently stored in a database. With all the processed data stored in the data explorer database we can start creating dashboards from it.
Let's see again the diagram of the complete flow.

We have already implemented the first 3 steps, now we just need to read and transform the data according to our needs.
IoT Hub configurations
Before continuing we should create a consumer group in the IoT Hub. This consumer group is going to be used later by the stream analytics job to read the events.

Azure Data Explorer cluster
Tip: Create all the resources under the same resource group. It will be easier to delete everything later.
Create the cluster
Before creating and configuring the Stream analytics job we must create the data explorer cluster. To create it you can follow the following steps:
Navigate to the Data explorer cluster page

Create the cluster with the following configurations

Note that the cluster creation can take some time, in my case it took around 15 minutes.
Don't forget to select the developer tier. The cost of the data explorer cluster can be quite high!
Create the database to store the telemetry data
To store the telemetry data we have to create a database in the cluster.
Open the databases tab inside your cluster configuration page
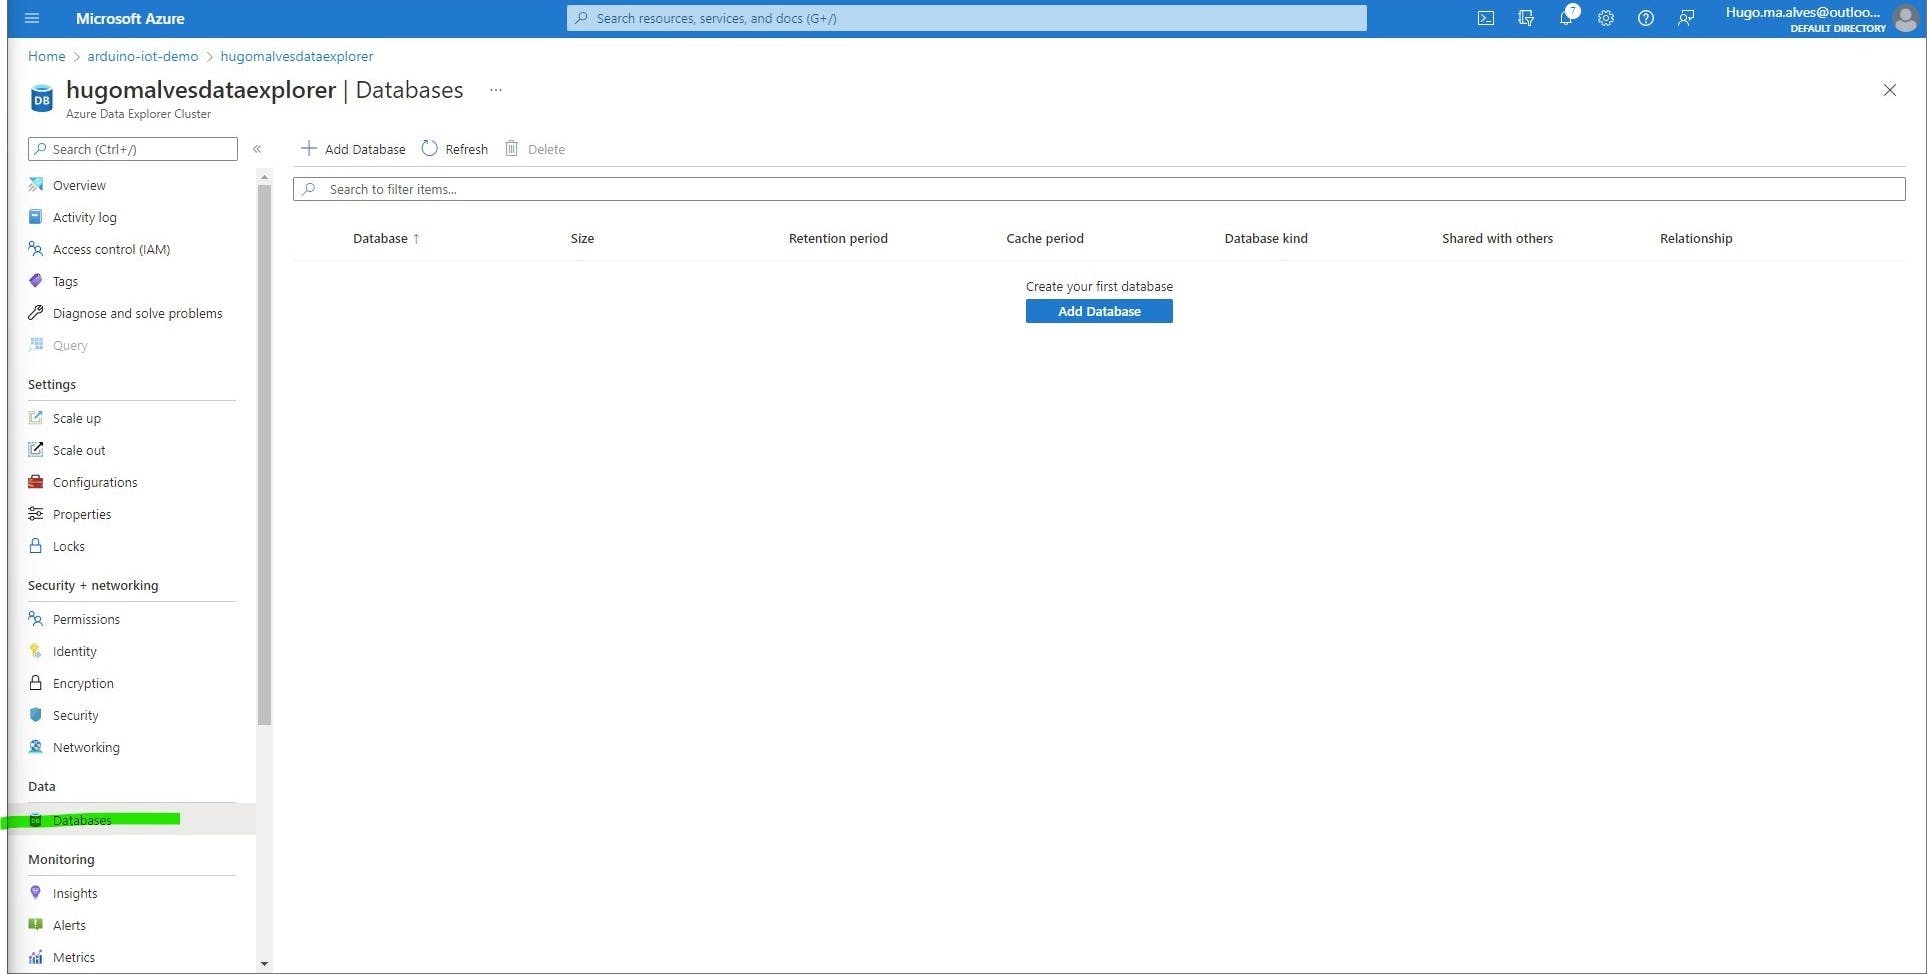
Create the database with the following configs

Create the database tables and schema
Let's now create the table and schema that will store the telemetry data exported from IoT Hub. First, navigate to the recently created database page, and then follow the following steps:
Right click on the database name and then on the "create table". You will be redirected to the azure data explorer page

Create a new table

Define the source for the table - none

Create the columns

Instead of manually typing each column name and type you can use the following command:
.create table ['telemetry'] (['temperature']:real, ['deviceId']:string, ['EventEnqueuedUtcTime']:datetime)
And that's all, now we have a table ready to store the telemetry data. The next step is to populate this table with the data from IoT Hub.
Stream Analytics Job
The stream analytics job is going to be responsible to get the raw data from IoT Hub, transform it and then send it to azure data explorer database to be persisted.
Create the Job
Navigate to the Stream analytics Job page and click create

Create a job with the following configuration

Configure the job inputs
Now we are going to define the inputs of this job. As said before, the input of this job is the data that is arriving from the IoT Hub, we have to configure an input specifying the origin and the format of the data.
Navigate to the Inputs tab on the Stream analytics Job page
Select the "IoT Hub" type
Create an input job with the following configurations

Configure the job outputs
In this step, we are going to create the output for the data. The transformed data from the input will be sent to whichever system we configure in the output, in this case, we are going to use azure data explorer, but we could also export the data to CosmosDB for example.
Navigate to the Outputs tab on the Stream analytics Job page
Select the "Azure data explorer" type
Create an output job with the following configurations

Create a query to connect the input to the output
Having defined the input and output data is not enough to complete the flow from IoT Hub to data explorer. As we saw before we still have to do some transformations to the data before being ready to be used by data explorer. This is the job of que query that we will create now.
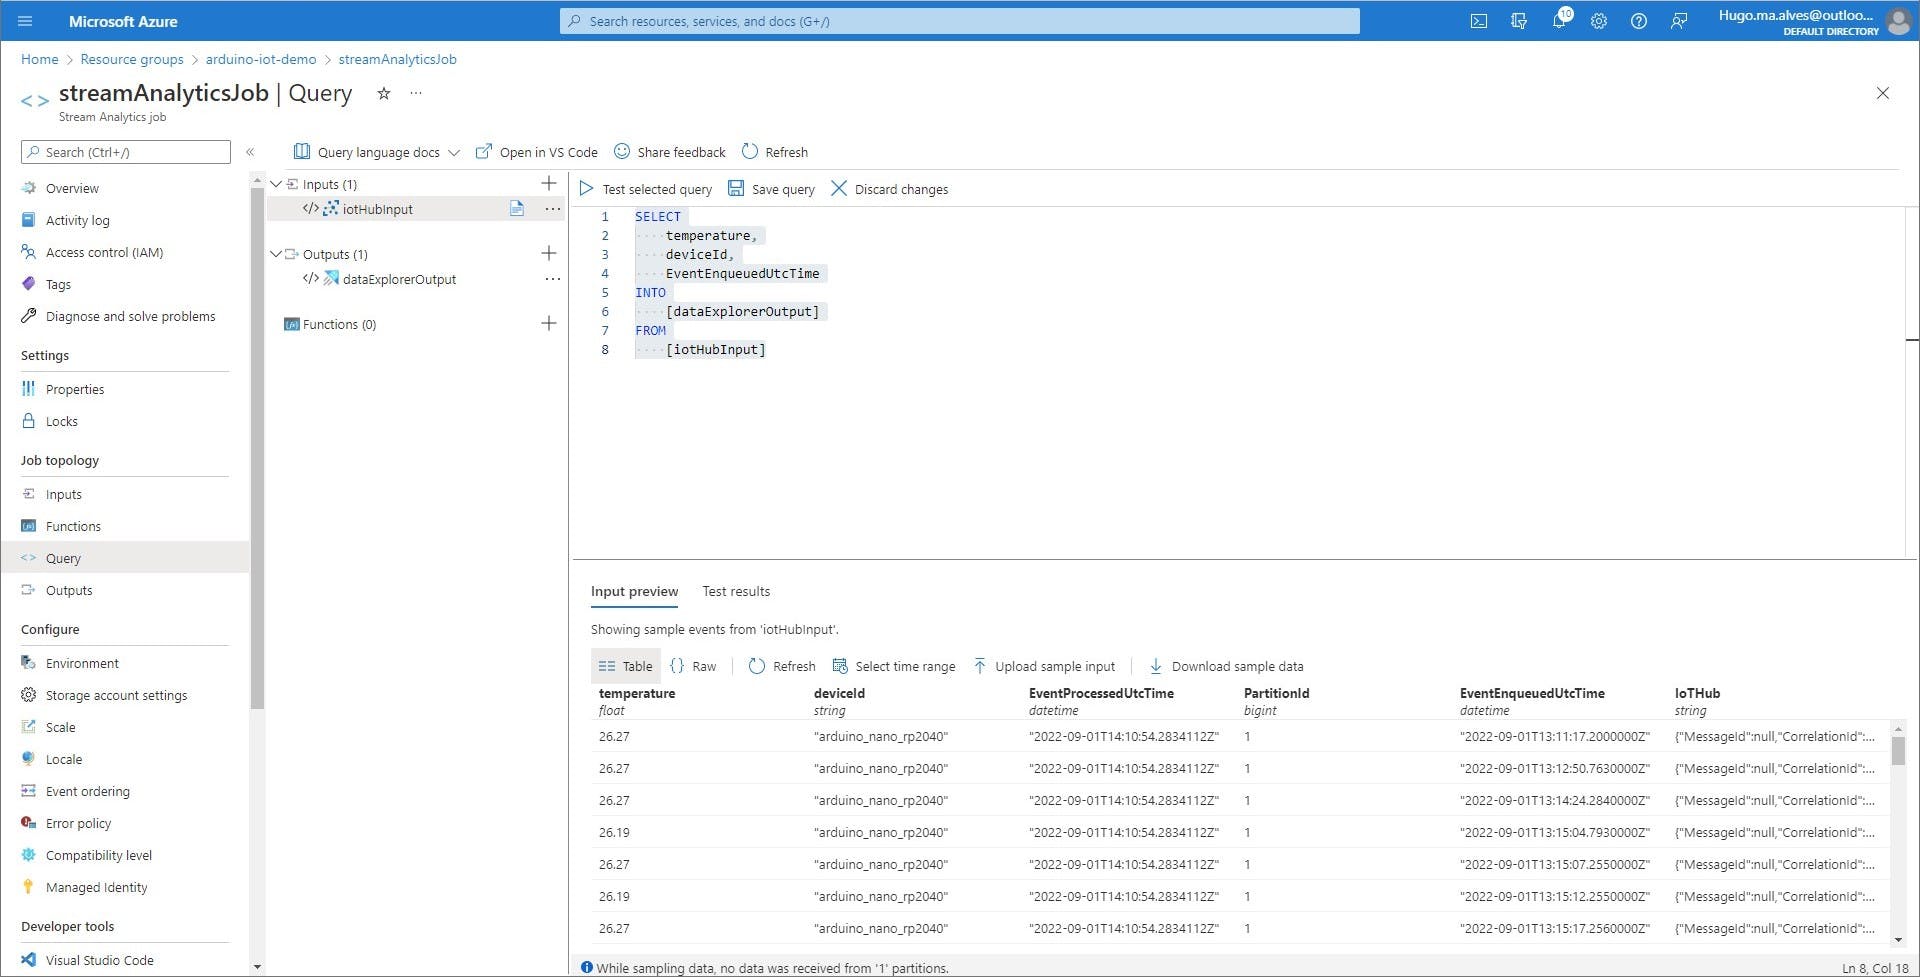
On the Stream analytics job page navigate to the query tab and paste the following query:
SELECT
    temperature,
    deviceId,
    EventEnqueuedUtcTime
INTO
    [dataExplorerOutput]
FROM
    [iotHubInput]
This query will read data from the input(IoTHub), and write it to the output (data explorer database). Since we don't need all the data to create the dashboards, we will only select the temperature, deviceId and EventEnqueuedUtcTime values. All the other values sent to Azure Iot Hub will not be propagated to the data explorer database.
After clicking save query you can test the query before starting the job. If you click on "Input preview" you can see the raw data that is arriving to the stream job from the IoT Hub. If you don't see any data just click on "refresh", it can take some seconds until you see some records appearing. The records shown on this tab are the input of the previous query.

On the "Test Results" tab you can see the result of the query. As expected, you will only see three columns, the temperature, the deviceId and the EventEnqueuedUtcTime. This is the data that will be stored in the data explorer database.

Start the stream analytics job
The last step is to start the stream analytics job, all of the configurations we did can't be done while the job is running. While the job is stopped nothing is being sent to data explorer. To start the job you should open the overview page and click start.

Azure data explorer dashboards
If all of the previous configurations were done correctly we now have everything we need to start creating the dashboards. The temperature measurements should be flowing from the Arduino to IoT Hub, then to the stream analytics job and finally to the data explorer database.
Let's now explore the Azure data explorer application. You can find the azure explore URL in the data explorer cluster overview page. You should open it on a new tab.

Verify that the stream analytics job is storing the transformed data in the telemetry table
On the azure data explorer application you should already see the database and table you created before. This table will contain the filtered data (temperature, deviceId and time).
To validate the data you can run the following KQL query:
telemetry
| take 100 | order by EventEnqueuedUtcTime  desc

Note, before running the KQL query you should select the "telemetry table"
Note that there can be a delay of 5 minutes from the moment you start the stream analytics job until you start seeing data on the data explorer. If you don't see any data on the table please wait some minutes.
You can also check the analytics job metrics to see events the number of events that are being processed. In the next image, we see on the events count chart that the stream events job received 73 events and sent 73 to the data explorer database in the last 30 minutes.

Create a dashboard
Let's now create a simple dashboard that displays the temperature changes over time. I believe the steps needed to create the dashboard are quite straightforward and intuitive. However, since there are numerous steps involved,creating a screenshot for each can become tedious, you can grasp the overall concept by watching the following video.
The most "technical" part is the one to create the datasource. Here I just copied the URI from the data explorer cluster, then the data explorer can automatically fetch the existing databases for you to use.
And I used the following KQL query to populate the dashboard:
telemetry | where EventEnqueuedUtcTime between (['_startTime'] .. ['_endTime'])
Note This is not the same query you see in the video, the filter for the EventEnqueuedUtcTime wasn't present. However, you should add the filter to only fetch the strictly necessary data for the plot

Clean the resources
Don't forget to delete all the resources used. The data explorer cluster cost can be quite high!
If you followed the instructions of this guide you should have created all of your resources on a specific resource group. To delete everything you can just navigate to the resource group and delete everything.

Conclusion
In conclusion, this tutorial demonstrated how to build a room temperature monitoring system using Azure and Arduino Nano. By configuring IoT Hub, Azure Data Explorer, and Stream Analytics Job, you can efficiently process and store temperature data from the Arduino. With the data stored in Azure Data Explorer, you can create insightful dashboards to visualize temperature changes over time. Remember to clean up resources after the project to avoid unnecessary costs.